So long, and thanks for all the fish

This our last post here on pureVirtual, it’s been a great 4.5 years of learning, creating and sharing content with you all and the site will live on for a long time, serving the articles you like until we get tired of maintaining it 🙂

Me, Jonas Rosland, will continue blogging about things such as containers, management, documentation, coding, organizational changes and retro gaming over at jonasrosland.com.

For Magnus Nilsson’s great content on APIs, programming, virtualization and more, head over to mnilsson.net to read on the topics he is passionate about.

If you want to get in direct contact with me or Magnus you can do so on Twitter:
Jonas Rosland: @jonasrosland
Magnus Nilsson: @swevm

Posted in About | Tagged , | Leave a comment

Deploy GitHub’s Hubot for Slack automatically with Travis CI and CloudFoundry – Part 2

As you saw in Part 1 of this howto we now have a GitHub Hubot up and running on CloudFoundry, pretty cool! But let’s see if we can manage it in a more automated way, how about automatically deploying a new version of it as soon as we push our code up to GitHub? Sounds good? Cool, lets’ do it.

For this we’re gonna be using Travis CI, a CI/CD system that can automatically test your code and see if it works or not, mark it as “passing” or show errors, and if everything’s A-OK then deploy it somewhere or spit out an artifact. Since we all never do mistakes this is gonna work from the beginning, hopefully 🙂

First, put your stuff up on GitHub. I’ve created a repo for the bot we’re using currently at EMC {code}, have a look at it if you’d like. Once it’s there, sign in to Travis CI with your Github account, and you’ll see something like this:

Screenshot 2015-02-23 15.18.20

Enable the repo to monitored by Travis and let’s get started with enabling Travis support in your repo. It’s pretty simple, all you need is a file called .travis.yml in the root of your Hubot folder, and it should look something like this:

language: node_js
node_js:
- '0.10'
notifications:
  email: false

We’re now telling Travis that our code is using nodejs and we’re specifying the version we want to use to check if everything works. We’re also disabling email notifications as they can get a bit annoying after a while, but that’s entire up to you if you want to leave out.

Now push your changes to your GitHub repo and watch as Travis does it’s magic. Sometimes it takes a few minutes for it to show up but don’t worry, it will be taking care of your code rather soon.

Screenshot 2015-02-23 15.34.53

Alright, time to add another piece; the deployment to CloudFoundry. Since you already have the code up on GitHub there’s no need to push to CF from your local dev environment anymore! Let’s add some stuff to the .travis.yml file:

language: node_js
node_js:
- '0.10'
notifications:
  email: false
deploy:
 provider: cloudfoundry
 api: https://api.run.pivotal.io
 username:
   secure: yoursecuredusername
 password:
   secure: yoursecuredpassword
 organization: yourorg
 space: development
 on:
   repo: yourname/codebot
   branch: master

Deployment info added, but what is that “secure” part? It’s a really cool part of Travis, you can store secure information such as credentials and environment variables in the .travis.yml file in a way so they can’t be read by anyone else than the Travis CI system, making it very useful when storing stuff up on GitHub.

To create your own secured information strings, install the travis gem:

gem install travis

Now you can encrypt whatever you want:

$ travis encrypt somethingsecretlikeyourusernameorpassword
Please add the following to your .travis.yml file:

 secure: "FonSR3cMHrGW2WZajEWOBuaBwTmzsvXZf8rOrGE6G070fZwZwq6JZH36M6VJWB4G9m35Y9JhFW/zL7uspm0wslF9LpztepEgc2HgAKnvICT1F6yx0Awo9kdEvkpBiWlI6JVS1fMbwbQG5309/qAIevMb4doJR8sP3jt8LfA4KkI="

Make sure you encrypt all sensitive information you want to before you store it up on GitHub, ok?

We’re now gonna add the last piece of the puzzle, a manifest.yml file that’s necessary for CloudFoundry to understand what we’re deploying:

$ cat manifest.yml
---
applications:
- name: codebot
  memory: 256M
  no-route: true

Here we define the name of the app (codebot), the amount of RAM we want to allocate to it, and that we don’t need a CloudFoundry route to it (if you had issues in Part 1 because of your botname here’s how you fix it!).

Now, when you’re done with all the copy&pasting and the encrypting, push the changes up to GitHub again and hopefully you should see your Hubot come alive on CloudFoundry automagically! You’re awesome, now go have fun with your automated build environment and your awesome bot 🙂

Posted in Automation, ChatOps, How to, Hubot, Installation, Pivotal | Tagged | Leave a comment

Deploy GitHub’s Hubot for Slack automatically with Travis CI and CloudFoundry – Part 1

GitHub has created a really interesting bot called Hubot that can be used for many different things. It can connect to a multitude of different services such as IRC, Slack, HipChat, Twitter, and a lot more. Once it is there it can respond to different queries such as showing you maps, translate sentences, post cute images of pugs and even deploy applications for you. Yes, you read that right, you can use a bot that posts pictures from Reddit’s AWW to also deploy your services on Heroku, AWS etc.

hubot2

In these blog posts I’m gonna walk you through how you can run your Hubot on CloudFoundry, but not only that, we’ll have it connect to Slack for awesome chatops functionality and finally we’ll automate deployments of it using GitHub and Travis CI. I expect that you already have the command line tools git and cf cli installed and know how to use them. Alright, let’s get started!

First, let’s grab Hubot and make sure you go through the Getting started with Hubot guide all the way down to the Scripting part, you can stop there. Now you have Hubot up and running but it’s on your local machine, and of course you’d like to run it somewhere else. This is where services like CloudFoundry comes in, and it is actually very simple to get your currently stranded bot up into the PaaS of your dreams, all you need to do is the following:

cf push yourbotname

Voila! Your bot is now up and running on CloudFoundry, but it won’t connect to any services. Luckily this is easily mitigated by looking at all the different connection adapters that are available for it, and we’ll use Slack as the example for this blog post. If you’re not already using Slack or something similar for team and project communications you’re definitely missing out and should start immediately 🙂

Troubleshooting: If your bot is named something that has already been taken as a CloudFoundry route, it won’t deploy. We’ll look into that in the next blog post but for now just name it something random.

To connect your Hubot to Slack, first go to https://yourteamnname.slack.com/services/new#diy and choose to connect a Bot:

Screenshot 2015-02-18 10.56.49

Then choose a name for your bot:

Screenshot 2015-02-18 11.50.10

Then you’ll be presented with an API Token, copy this as we’ll use it to set up your bot to connect to Slack correctly.

Screenshot 2015-02-18 11.51.14

Alright. Now time to change your bot to use the Slack adapter. The easiest way of doing this is to run the following:

yo hubot

Change the “Bot adapter” from campfire to slack, and press Y to overwrite the Procfile and package.json

Now let’s also set the correct environment variable for our bot so it knows what Slack team to connect to:

cf set-env yourbotname HUBOT_SLACK_TOKEN xoxb-11222211122-B2qPnCLi0WxSxtqMS3CRET

Now do another push so the changes we’ve made are live:

cf push yourbotname

You should now see something like this:

cf logs yourbotname --recent
<snip>
2015-02-18T12:30:32.11-0500 [App/0] OUT [Wed Feb 18 2015 17:30:32 GMT+0000 (UTC)] INFO Logged in as yourbotname of YourTeamName, but not yet connected
2015-02-18T12:30:32.21-0500 [App/0] OUT [Wed Feb 18 2015 17:30:32 GMT+0000 (UTC)] INFO Slack client now connected
2015-02-18T12:30:32.36-0500 [App/0] OUT [Wed Feb 18 2015 17:30:32 GMT+0000 (UTC)] ERROR hubot-heroku-alive included, but missing HUBOT_HEROKU_KEEPALIVE_URL. `heroku config:set HUBOT_HEROKU_KEEPALIVE_URL=$(heroku apps:info -s | grep web_url | cut -d= -f2)`
2015-02-18T12:30:32.51-0500 [App/0] OUT [Wed Feb 18 2015 17:30:32 GMT+0000 (UTC)] INFO Using default redis on localhost:6379

Your bot is alive and should be seen joining the #general Slack channel. You can also invite it to other channels by doing the following in your Slack client:

/invite yourbotname

You should now see the bot join like this:

Screenshot 2015-02-18 12.34.29

Awesome! You can now talk to it either in private messages or by asking it things, like “yourbotname help”. Now you should have a look at all the new and old Hubot scripts that can make your bot funny, useful or both 🙂

If you make any changes to your local repo for your bot, always make sure to do a “cf push yourbotname” after the local changes so you’ll get the online bot updated with those changes as well. But that starts to get old fairly quickly, and there should be a more efficient method of storing configurations and deploying them, right? Oh but of course there is! And we’ll cover all of that in Part 2, so for now, enjoy your new bot and have fun!

Posted in Automation, ChatOps, CloudFoundry, How to, Hubot, Installation, IT Transformation, Pivotal, Slack | 1 Comment

Creating a community and social media dashboard using Dashing and Keen.io

Last year I showed some people on Twitter and over at EMC World how you can create a cool dashboard with Dashing that shows a ton of stuff from an infrastructure perspective, and it was well received. A little over a month ago I started looking at the dashboard again but from another perspective, looking for social media interactions and community metrics. Last but not least we wanted to share this with the community, and I’ll explain how we created what is now live up and public here and what later became an interesting tool for analytics, using Keen.io as a backend.

dashboard_example

First off, Dashing is a beautiful dashboard created by the nice people at Shopify. It’s available for free and it’s very easy to get started with, just read the docs. When you have it up and running you can then feed data into the dashboard and it will auto-update in real-time. What’s really cool about this dashboard is that you can get data both from local jobs running on the server where you’re running the dashboard, and from external sources such as scripts or logging tools. I wanted our dashboard to be as simple as possible so I created a few jobs that run locally now with the possibility of adding external sources as well.

For the metric collection Dashing actually already has a lot of third-party created widgets that you can take and modify as you need. I’ve used a few like the Twitter and YouTube ones and also created a few that I needed for Docker Hub, StackOverflow and Constant Contact.

With that we were able to get a good current overview of how our community metrics were stacking up and see if we had a good response to different methods of reaching out to the community, and it was a great start. But we also wanted to add some way of storing the data and do some basic analytics of it. I looked into using Redis as a backend but really didn’t want to handle the storage part and neither did I want to build my own analytics tool. So I looked around and the always smart Matt Cowger told me to look at keen.io, so I did.

dashboard_analytics

Keen.io is a really cool app where you can store data using simple REST queries and then retrieve the data with analytics applied, super smart! So I looked into how and if I could apply and use this with Dashing, but didn’t find anyone that had done it before. So I dug a little deeper and found that keen.io has a Ruby gem, which I could then just add into the Dashing jobs and start feeding the data collected for the dashboard into keen.io.

Let’s look at an example of a Dashing job that’s been enabled for keen.io, I’m using the Twitter one from foobugs as an example, edits are in bold.

#!/usr/bin/env ruby
require 'nokogiri'
require 'open-uri'
require 'keen'

# Track public available information of a twitter user like follower, follower
# and tweet count by scraping the user profile page.

# Config
# ------
twitter_username = ENV['TWITTER_USERNAME'] || 'emccode'

SCHEDULER.every '60m', :first_in => 0 do |job|
 doc = Nokogiri::HTML(open("https://twitter.com/#{twitter_username}"))
 tweets = doc.css('a[data-nav=tweets]').first.attributes['title'].value.split(' ').first
 followers = doc.css('a[data-nav=followers]').first.attributes['title'].value.split(' ').first
 following = doc.css('a[data-nav=following]').first.attributes['title'].value.split(' ').first

 send_event('twitter_user_tweets', current: tweets)
 send_event('twitter_user_followers', current: followers)
 send_event('twitter_user_following', current: following)
 Keen.publish(:twitter, { :handle => twitter_username, :tweets => tweets.to_i, :followers => followers.to_i })
end

Yes, it’s that simple! But, you might say, how does it know who to store the information for? It’s not configured for any project, doesn’t have any access keys or anything! I’ll get to that.

First, add the following to your config.ru to make use of the dotenv gem. Make sure you put this at the very top!

require 'dotenv'
Dotenv.load
require 'dashing'
<snip>

Second, add the following to your Gemfile:

gem 'keen'
gem 'dotenv'

Then run “bundle” to install the dotenv and keen gems.

Now all you have to do is to store your keen.io variables in a file called .env at the root of the dashing directory and you’re good to go, like this:

KEEN_PROJECT_ID=yourprojectid
KEEN_MASTER_KEY=yourmasterkey
KEEN_WRITE_KEY=yourwritekey
KEEN_READ_KEY=yourreadkey

Now start the dashboard and you should see data coming in both to your awesome dashboard and to your project over at keen.io. The metrics can then be visualized by using their excellent examples over here, and you can see what we’re currently using for EMC {code} over here. Pretty cool I must say 🙂

Enjoy!

Posted in Analytics, EMC, Social Media, Visualization | 3 Comments

New role, new responsibilities, same face

It’s that time of year again! Well not really, but it’s that time of my career at least. For those of you keeping track I’ve been at EMC now for a bit over 4 years. I was part of the vSpecialist team for 3 years, and last year around this time I moved into the Office of the CTO (and from Stockholm to Boston with my wife). I’m now moving to yet another interesting opportunity within EMC, but perhaps not a role traditionally associated with EMC.

I’m sure you all have noticed the way our industry, your own job (if you work in IT) and even this blog have become more software focused. It’s not all about pushing, installing and running hardware anymore. It’s much more interesting than that. And you’ve probably also noticed the increased speed of which new software and gets rolled out. Not every year. Not every half year. Sometimes not even just once a month, but several times a week or even many times a day!

This has got me excited. I’ve been diving into the software-defined world for some time now, and that has gotten me to realize that we’re all going to be replaced by a small shell-script. Wait, no, that wasn’t it at all. It’s gotten me to a point where I see that software and the development of it as more important and interesting than ever. Yes, that’s the one.

The way we see software has changed a lot in the last few years. Boxed software has been replaced by downloadable versions. Packaged proprietary software has been replaced by open source projects on GitHub. It’s a more open and accessible software world than ever before, and we can all be a part of the community that drives this change.

This community is the reason why interesting projects like Docker and OpenStack have become large successes, both as top-of-mind products in their respective areas and technologies that are always evolving and fulfilling more and more of customer requirements. This community is what drives software development, and these projects wouldn’t be the same without it.

emc_code_logo_stacked_colour

This is why I’m super excited to announce that I will from now on be a part of a great team of people who have the same drive and vision, and wants to be a part of something larger. We all want to be a part of the larger developer community, contributing, helping and driving innovation forward. I am joined by Brian Gracely, Clinton Kitson and Kendrick Coleman (with more coming) at EMC CODE, where my role will be a Developer Advocate. So what will I do there? Well, essentially:

As a Developer Advocate, I will be a passionate advocate for new technology in the outside world, as well as a vocal advocate for developers’ needs within EMC. I thrive on the cutting edge of technology and love seeing exciting, new applications and business that other developers are building. I will drive momentum for exciting new technologies through a variety of means. I will work with some of our most strategic partners who push our technology to its limits – and to make them successful as they build apps that showcase the potential of our APIs and products. I will be one of many public faces of EMC representing interesting products, speaking at conferences, on panels, at user groups, actively blogging & tweeting, and engaging with the larger developer community.

That means a lot more code, automation and EMC projects that will be published on GitHub and other sites which I think we will all enjoy. It’s going to be a really interesting mission, and one I hope you all will enjoy as I blog more about it.

And I want to talk to YOU if:

  • You have any interesting technology from outside EMC that you think would fit us
  • You have any interesting technology from within EMC that you think the world would like to see (code, blog, project)
  • You want us to speak at your next event
  • You have a great idea for a hackathon with EMC products

You can reach out to me at firstname dot lastname at emc dot com or on Twitter.

For more information about EMC CODE, I highly recommend reading Clinton Kitson’s excellent blog post on the team and the industry together with Kendrick Coleman’s journey here, and also visit our new team site at emccode.github.io and follow the team on Twitter!

Posted in EMC, Experiment, News, Predictions | 1 Comment

Server locality using Razor and LLDP

Recently I had a discussion with a great customer where they wondered if there was a smart and automated way of deploying operating systems together with applications. Of course, I said, you can use Razor and Puppet for those things. However, they wanted a completely hands-off approach that included a function for server locality. The hands-off piece is already built-in with Razor, but server locality? Not really. Razor just pulls in nodes that fit the hardware specifics from a pool of available nodes, and deploys operating systems on them. What the customer wanted was a way to say that the top 5 servers in a rack should be deployed with something, the next 10 something else, and the bottom 5 with a third thing. So what to do?

Razor Server Locality with LLDP example

Read the whole thing here at Puppet Labs blog!

Posted in Automation, Converged Infrastructure, EMC, How to, Installation, Puppet, Razor | Leave a comment

How to create a Panamax template for really cool Docker management

My last post about Panamax showed how to get started quickly with it in OS X, now let’s go ahead and look at why Panamax is an awesome tool and showcase one of it’s main strengths; Templates!

If you look at the really long list of all Docker images that exist out there, you will see that many are one of two things:

  1. Multi-app images where everything needed to run a service is baked in
  2. One-app images that aren’t connected to anything else

There are problems and benefits with both. The multi-app images are usually full of all needed dependencies and configurations for an app and don’t adhere to the “12 Factor App” rules, but they’re great if you just want to try out a new tool or app without having to invest too much time.

The one-app images are usually adhering to the “12 Factor App” rules when looking at isolating code, but they usually lack in the documentation of how to actually connect this specific containerized app to another app. Think of it as having a database in a container without any documentation on how to connect a web server app to it. Not really useful.

This is where Panamax really shines. The templates within Panamax actually connect regular one-app images with a really easy to read and use fig-like construct, to make sure we can have a system of isolated apps where the parts can be exchanged, modified, increased and decreased (think web scale HA environments for instance). Pretty awesome!

So, how do you use it? I’ll try to explain using an app template I created for the Panamax App Template challenge, “Sensu with separate Redis, RabbitMQ and Uchiwa” consisting of the following containers:

  1. redis
  2. Uchiwa
  3. Sensu
  4. RabbitMQ

When creating this new application template within Panamax, do the following:

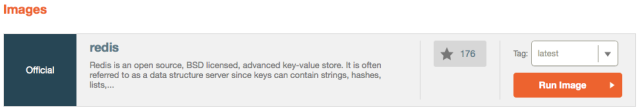
Search for redis which will be used as the key-value store for Sensu:

Screen Shot 2014-09-08 at 7.52.58 PM

Choose to run the redis image:

Screen Shot 2014-09-08 at 7.53.12 PM

Verify that redis starts running in your new application under “application services”. You can change the name of you application from “redis:latest_image” to something more useful if you’d like, same with the category from “Uncategorized” to something else:

Screen Shot 2014-09-08 at 7.54.47 PM

And to make sure we have an easy to understand application, let’s use the awesome “categories” function. Create a new category for the “GUI” where we’ll add the Uchiwa image in just a bit:

Screen Shot 2014-09-08 at 7.56.46 PM

Click to add a service to it, search for the correct Uchiwa image and add it to the app:

Screen Shot 2014-09-08 at 7.58.44 PM

Repeat these steps to create categories and services for Sensu and RabbitMQ, and you’ll end up with something like this:

Screen Shot 2014-09-08 at 8.04.44 PM

Cool! Now we have a bunch of containers running in one application construct, but we’re not done yet. Now we can start connecting them together 🙂

Click the magnify glass icon on the RabbitMQ image to enter another dimension of what Panamax can do:

Screen Shot 2014-09-08 at 8.06.53 PM

What you’ll now be presented with is a vast array of configuration options available for this image, especially which ports we want to publish to other containers and how we can actually connect them together:

Screen Shot 2014-09-08 at 8.09.28 PM

Make sure you expose the correct ports for each image:

  1. RabbitMQ: 5672, 15672
  2. Redis: 6379
  3. Sensu: 4567 (I’m not making this one up :))
  4. Uchiwa: 3000

Ok, nice, now you’ve opened up the ports so that the apps can actually talk to each other. But they don’t, yet. Let’s get to that now!

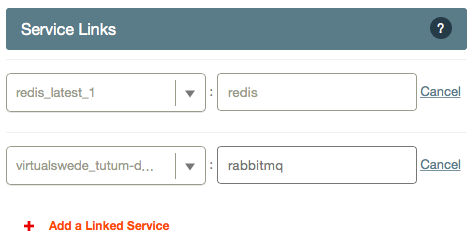
On the Sensu service, add the redis and rabbitmq images as two “linked services” like this:

Screen Shot 2014-09-08 at 8.15.45 PM

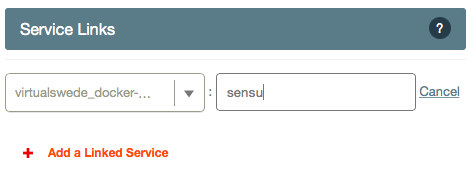
On the Uchiwa image, do the same but this time link it to the Sensu image:

Screen Shot 2014-09-08 at 8.17.45 PM

When you’re finished, go back to the application screen and click the little link icon on the right corner. You should see something like this:

Screen Shot 2014-09-08 at 8.20.00 PM

Whoho! You have now created an application template! You’ve added 4 Docker images that each perform an important task, you’ve exposed ports on some of them and you have linked them together. You’re pretty great, you know that?

Now let’s actually access this application, add a port binding for Uchiwa and link it to the already exposed container port:

Screen Shot 2014-09-08 at 8.48.05 PM

After that, run the following command in your preferred terminal:

VBoxManage controlvm panamax-vm natpf1 rule1,tcp,,8997,,8080

Now you can point your browser to http://localhost:8997 and you’ll be able to to see the Uchiwa GUI, connected to the Sensu API, storing information in Redis and RabbitMQ. Awesome work, dear reader!

Now this template can be saved into Github so you can share them with your fellow colleagues, partners, customers etc, just follow the instructions outlined here. Have fun!

Posted in Automation, Docker, How to, Installation, Panamax | Leave a comment

Simple how-to install Panamax Docker management on OS X

687474703a2f2f70616e616d61782e63612e74696572332e696f2f70616e616d61785f75695f77696b695f73637265656e732f70616e616d61785f6c6f676f2d7469746c652e706e67

Panamax was released publicly earlier today, and I think it’s a really cool tool for managing, controlling and connecting Docker containers in a simple and efficient way. Panamax uses Docker best practices in the background, providing a friendly interface for users of Docker, Fleet & CoreOS. Yes, user friendly. No more command line, unless you really want to 🙂

There are great instructional videos on the Panamax wiki here, here and here, but to get started really quickly you can use the following commands to install everything that you need to get Panamax up and running immediately. I do recommend watching the videos as well, they’re full of great information about how Panamax works and how it’s used.

We’re gonna use Homebrew (if you don’t already have it you’ll love it soon) and Homebrew Cask (awesome tool for installing and managing hundreds of apps) to install everything needed, instead of downloading files, clicking, and installing applications manually 🙂

Here we go:

Install Homebrew and Homebrew Cask:

ruby -e "$(curl -fsSL https://raw.github.com/Homebrew/homebrew/go/install)"
brew install caskroom/cask/brew-cask

Now install VirtualBox and Vagrant:

brew cask install virtualbox
brew cask install vagrant

And finally, install and initialize Panamax:

brew install http://download.panamax.io/installer/brew/panamax.rb
panamax init

You should now see something like this:

Screen Shot 2014-08-12 at 2.17.13 PM

After a few minutes, a browser window will open and show you your own Panamax environment, and you’re now ready to start using it!

Screen Shot 2014-08-12 at 2.18.04 PM

That’s all there is to it, now head over to the Panamax documentation and read up on how to use it, and perhaps even win a Mac Pro or an iPad Air? 🙂

Posted in Automation, Docker, Homebrew, Homebrew Cask, How to, Installation, Panamax, Vagrant, VirtualBox | 1 Comment

EMC is now a part of the Puppet Labs Supported program

Screenshot 2014-07-24 16.16.20

Disclaimer: EMC is a proud member of the Puppet Supported Program. These are my thoughts and not necessarily those of my employer.

I work at EMC which is a federation of well-known brand names; VMware, RSA, Pivotal & EMC II, and they all have the same goal: the Software-Defined Data Center. It’s become a real buzzword these last two years where anyone who’s anyone within the IT industry is embracing the SDDC; all our competitors and partners, and our joint customers, and I’d like to explain my take on it. I see cloud as the operational function of being able to be agile with data center resources, and SDDC being the technical implementation to make sure you can actually deliver on the promises made by that operational model.

I’ve published a blog over at Puppet Labs about the tools, technology and methodology we can use to make this evolution happen, go read it there 🙂

Posted in Automation, EMC, IT Transformation, News, Puppet | Leave a comment

Summary: High performance Splunk with VMware on top of EMC ScaleIO and Isilon

Splunk plus EMC4.001

I recently did a project involving several moving parts, including Splunk, VMware vSphere, Cisco UCS servers, EMC XtremSF cards, ScaleIO and Isilon. The project goal was to verify the functionality and performance of EMC storage together with Splunk. The results of the project can be applied to a basic physical installation of Splunk, and I added VMware virtualization and scale-out storage to make sure we covered all bases. The post is actually not here, but located over at Cisco’s blog, so please head over there to read it!

Posted in Big Data, Cisco, Converged Infrastructure, EMC, How to, Isilon, ScaleIO, Splunk, VMware, vSphere5 | Tagged , , , , , | Leave a comment